| Re: Chronicle Of A Data Scientist/analyst by yemyke001(m): 4:51pm On Jun 09, 2020 |
KunSegzy100:
hello guys, i have my first assessment (aptitude test followed by interview) for data analyst role scheduled for tomorrow, kindly give me tips to aid preparation. I will be glad if you can share the site where you see the opening and my mail is yemyke@gmail.com.. I will be more glad if you can remove your vital info from your CV and help send the carcass to my mail. Thank you in anticipation. |
| Re: Chronicle Of A Data Scientist/analyst by yemyke001(m): 5:05pm On Jun 09, 2020 |
I will be glad if you can help with a template of your CV to model mine and good sites to search for opening. Thanks |
| Re: Chronicle Of A Data Scientist/analyst by yemyke001(m): 5:06pm On Jun 09, 2020 |
mcemmy0z:
Be ready to work on their data. Is one thing of knowing how to do all those data trick, plotting chat, or graph, prediction, but explaining them is the main work there, ground yourself well on how to tell a story with your data. Know how to explain a relationship between data, correlation. And you will be asked to show your previous works. If part of their requirements required you to know SQL, Google on self join, there is this one common question they use to ask, manger to employee relations. If you are going to work on python, make sure you store your code somewhere, if u are using Jupiter just create a new page or folder and store most of your code for data preprocessing and machine learning on it.. perhaventure if you will be giving any data just copy the data into the folder where you stored your code and fire on with Jupiter.
I will also advice you to use power Bi for your Visualization, tableau will be good cause of it's dashboard and story telling page, it will catch the audience than using seaborn or matplotlib.
Don't just do anything without knowing how to explain them. I can assure you that you will forget all your code.. store them well. They might ask u to present your work with power point. Be ready to defend every u will do.
Master that power Bi well, for now is really treading in Nigeria, lost a job opportunity last two months cause I was yet to mastered it then, they were looking for a professional in PowerBI and I was new to that app then.
I will be glad if you can help with a template of your CV to model mine and good sites to search for opening. Thanks |
| Re: Chronicle Of A Data Scientist/analyst by Boxers02: 5:23pm On Jun 09, 2020 |
|
| Re: Chronicle Of A Data Scientist/analyst by mcemmy0z: 6:46pm On Jun 09, 2020 |
yemyke001:
I will be glad if you can help with a template of your CV to model mine and good sites to search for opening. Thanks Download indeed app on Google play store register as a data analyst and wait for data analyst job on your mail everyday. 11 Likes 3 Shares |
| Re: Chronicle Of A Data Scientist/analyst by yemyke001(m): 8:02pm On Jun 09, 2020 |
mcemmy0z:
Download indeed app on Google play store register as a data analyst and wait for data analyst job on your mail everyday. Thanks Bro |
| Re: Chronicle Of A Data Scientist/analyst by Gcool2(m): 8:10pm On Jun 09, 2020 |
mcemmy0z:
Be ready to work on their data. Is one thing of knowing how to do all those data trick, plotting chat, or graph, prediction, but explaining them is the main work there, ground yourself well on how to tell a story with your data. Know how to explain a relationship between data, correlation. And you will be asked to show your previous works. If part of their requirements required you to know SQL, Google on self join, there is this one common question they use to ask, manger to employee relations. If you are going to work on python, make sure you store your code somewhere, if u are using Jupiter just create a new page or folder and store most of your code for data preprocessing and machine learning on it.. perhaventure if you will be giving any data just copy the data into the folder where you stored your code and fire on with Jupiter.
I will also advice you to use power Bi for your Visualization, tableau will be good cause of it's dashboard and story telling page, it will catch the audience than using seaborn or matplotlib.
Don't just do anything without knowing how to explain them. I can assure you that you will forget all your code.. store them well. They might ask u to present your work with power point. Be ready to defend every u will do.
Master that power Bi well, for now is really treading in Nigeria, lost a job opportunity last two months cause I was yet to mastered it then, they were looking for a professional in PowerBI and I was new to that app then.
pls I am just a learner, curious to know something..pls u indicated that the guy should store his code somewhere.. Do pple have any particular code they work with? I believe code will be based on the task given,How will he know the task he would be given to be sure that his code will work. ?. pls enlighten me more or I want to get the part u said "store your code". 1 Like |
| Re: Chronicle Of A Data Scientist/analyst by Nobody: 8:33pm On Jun 09, 2020 |
|
| Re: Chronicle Of A Data Scientist/analyst by mcemmy0z: 9:33pm On Jun 09, 2020 |
Gcool2:
pls I am just a learner, curious to know something..pls u indicated that the guy should store his code somewhere..
Do pple have any particular code they work with?
I believe code will be based on the task given,How will he know the task he would be given to be sure that his code will work.
?.
pls enlighten me more or I want to get the part u said "store your code". If you familiarize yourself well enough to python for data preprocessing you will realize that most of the process are same, from importing all necessary libraries to importing your data, checking the head, doing some descriptive analysis on it, removing NAN values or dropping unwanted columns, melting columns, changing columns name.. there are sepeate code for all these, but have saved everything somewhere cause I don't have time to code, I just have to rename the data name to the one am using. Don't know when last I even type code. Same with machine learning, both supervised and unsupervised, whether to create dummie variable or I want to scale data. I saved all the code there for each machine learning model too ranging from linear to logistics regression, KNN, decision trees etc.. even when using Visualization libraries like seaborn there are some crazy plot that I can't even cram the code so I have to save them all and all those code for different lines, colors too. Working smart is what it takes. 15 Likes 2 Shares 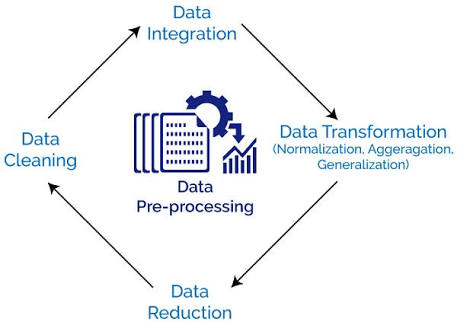
|
| Re: Chronicle Of A Data Scientist/analyst by Boxers02: 10:03pm On Jun 09, 2020 |
|
| Re: Chronicle Of A Data Scientist/analyst by Gcool2(m): 10:13pm On Jun 09, 2020 |
mcemmy0z:
If you familiarize yourself well enough to python for data preprocessing you will realize that most of the process are same, from importing all necessary libraries to importing your data, checking the head, doing some descriptive analysis on it, removing NAN values or dropping unwanted columns, melting columns, changing columns name.. there are sepeate code for all these, but have saved everything somewhere cause I don't have time to code, I just have to rename the data name to the one am using. Don't know when last I even type code. Same with machine learning, both supervised and unsupervised, whether to create dummie variable or I want to scale data. I saved all the code there for each machine learning model too ranging from linear to logistics regression, KNN, decision trees etc.. even when using Visualization libraries like seaborn there are some crazy plot that I can't even cram the code so I have to save them all and all those code for different lines, colors too. Working smart is what it takes. Thanks for this explicit response ..pls check ur mail. |
| Re: Chronicle Of A Data Scientist/analyst by Theflint1(m): 12:44pm On Jun 10, 2020 |
Macsjebs check the visualization for top front-page posters. cochtrane:
As a budding data scientist who visits NL often, it's not surprising that you start to get more than interested in the some of the topics making front page and how frequent topics from individual sections reach the top. I have been looking into this for a while and thought it would be nice to do some investigation in this regard. For example, which section makes front page most often? How often do we see programming topics get to the front page? Who posts more often on the front page? Is it really lalasticlala, as is frequently supposed, or is it someone else? What exactly has been the relationship between lalasticalala and snakes over the past year? Some people think he loves to push snake topics to the frontpage more often than other topics. What else can we learn from the topics making frontpage? Like for example, are they mostly about Buhari or something else?
To this end, I scrapped the front page data and obtained more than 28,000 records. You can download this data set I obtained here on my github. If you are a data science enthusiast who also likes Nairaland, this may be good motivation to dig into a topic that interests you. You will find a metadata file in the sublink as well and can investigate what the attributes are about. You've got titles, links, sections and time that posts made front page. It's a year of data from 31st May 2019 till date. It turns out to get the whole frontpage information may need more than 230,000 records! That's huge, and probably not so wise to collect for a quick, lazy analysis. Except, of course, you have business motives
For me, I was interested in a few topics.
First, from which section did we get the most frontpage material over the past year? Apparently, it is "Politics". It trumps everything. "Celebrities" come a close second. Not surprising, right? What with the volume of Bobrisky posts and co. And then "Crime" comes third. Does this point to a high frequency of crime in Nigeria? I leave that question to you. "Programming"? Didn't even make bank one time!
The fact that politics make frontpage more often clearly shows that top on our discourse as Nigerians is probably politics, if Nairaland reflects a microcosm of the Nigerian environment, which I feel it does.
Who posts more often on the frontpage? Not lalasticlala like you might think. It's a person called dre11; at least over the last year. Maybe you know him, may you don't. Lalasticlala is not even in the top three.
One quirky thing I found, however, was that the time it takes for a post to get to frontpage has a heavily right-skewed distribution. Before plotting this, I lazily thought it might be normally distributed, cos...well, a lot of things are normally distributed and it shouldn't be unusual to have this normally distributed as well; few make front page early, few late, and most are in between. Right? On the contrary, the reality is skewed. I feel the heavy skewness probably points to deliberate human intervention. Most posts make front page early, not late. They are created and in little time pushed to the front page. Evidently in a deliberate fashion. Else the data should be normally distributed, don't you think? Anyways, that's what my data shows. Maybe, better insight could be derived though if one scraped randomly over the past several years in order to obtain a truly random sample.
And there were a few threads which made front page late. Very late! In the past year, we have had threads from 8 years ago make frontpage. Yes, 8 years ago! Thats's 2012. And then there are those that were initially posted 5 years ago before they made front page. Perhaps you can find more if you looked into the data set?
Anyways, getting your hands dirty with a data set is always a good way to learn data analysis. If you need help with navigating this, you can buzz me.
2 Likes 1 Share |
| Re: Chronicle Of A Data Scientist/analyst by Grandlord: 1:02pm On Jun 10, 2020 |
Saw this somewhere and I thought it might help someone on here organize their learning process. You're welcome  20 Likes 1 Share 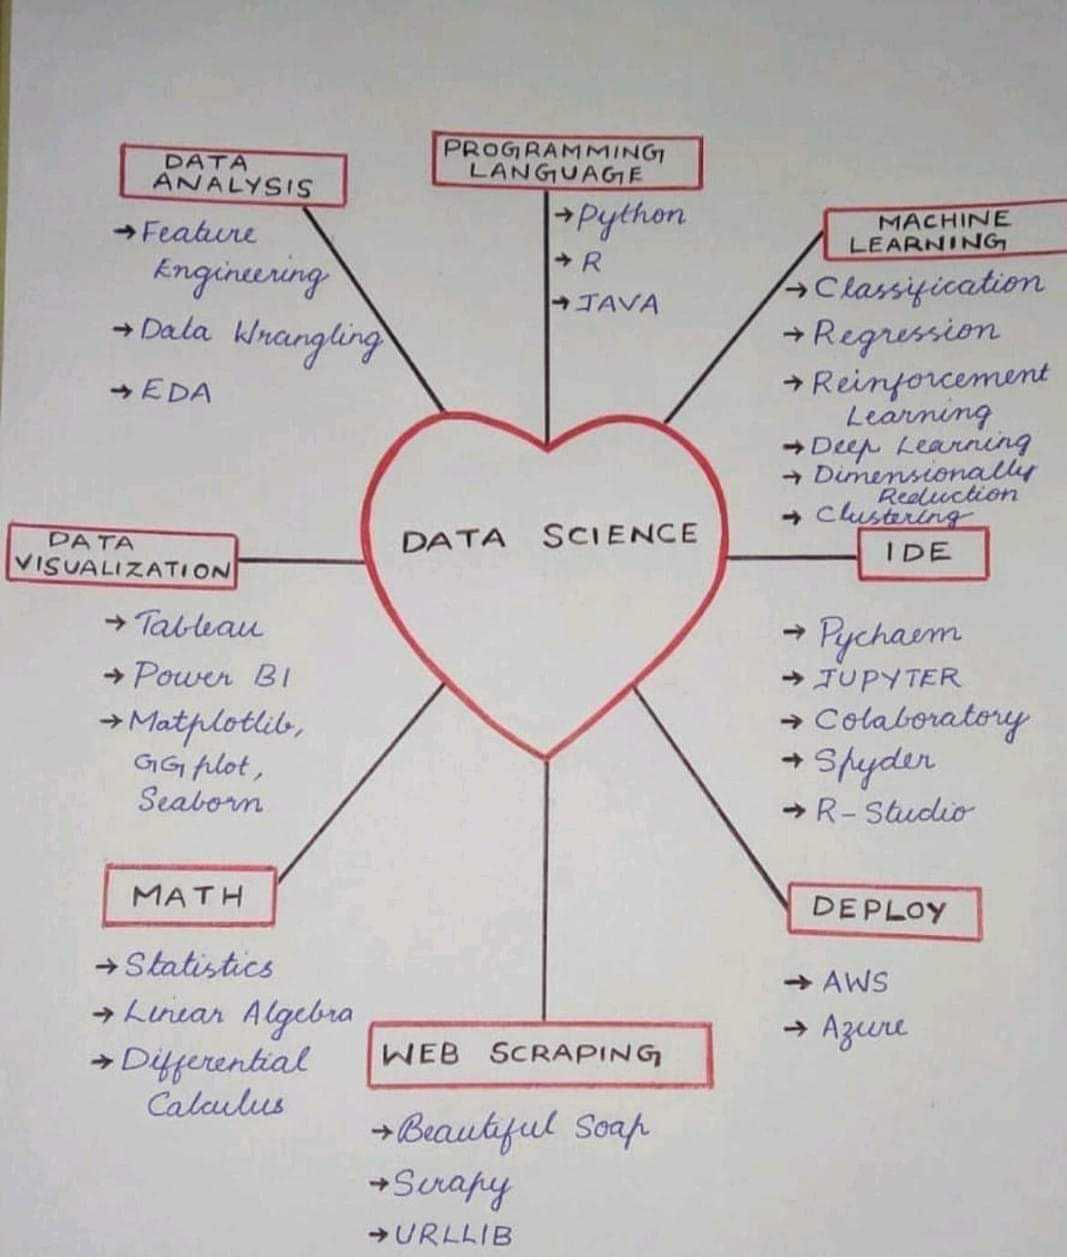
|
| Re: Chronicle Of A Data Scientist/analyst by cochtrane(m): 1:15pm On Jun 10, 2020 |
cochtrane:
As a budding data scientist who visits NL often, it's not surprising that you start to get more than interested in the some of the topics making front page and how frequent topics from individual sections reach the top. I have been looking into this for a while and thought it would be nice to do some investigation in this regard. For example, which section makes front page most often? How often do we see programming topics get to the front page? Who posts more often on the front page? Is it really lalasticlala, as is frequently supposed, or is it someone else? What exactly has been the relationship between lalasticalala and snakes over the past year? Some people think he loves to push snake topics to the frontpage more often than other topics. What else can we learn from the topics making frontpage? Like for example, are they mostly about Buhari or something else?
To this end, I scrapped the front page data and obtained more than 28,000 records. You can download this data set I obtained here on my github. If you are a data science enthusiast who also likes Nairaland, this may be good motivation to dig into a topic that interests you. You will find a metadata file in the sublink as well and can investigate what the attributes are about. You've got titles, links, sections and time that posts made front page. It's a year of data from 31st May 2019 till date. It turns out to get the whole frontpage information may need more than 230,000 records! That's huge, and probably not so wise to collect for a quick, lazy analysis. Except, of course, you have business motives
For me, I was interested in a few topics.
First, from which section did we get the most frontpage material over the past year? Apparently, it is "Politics". It trumps everything. "Celebrities" come a close second. Not surprising, right? What with the volume of Bobrisky posts and co. And then "Crime" comes third. Does this point to a high frequency of crime in Nigeria? I leave that question to you. "Programming"? Didn't even make bank one time!
The fact that politics make frontpage more often clearly shows that top on our discourse as Nigerians is probably politics, if Nairaland reflects a microcosm of the Nigerian environment, which I feel it does.
Who posts more often on the frontpage? Not lalasticlala like you might think. It's a person called dre11; at least over the last year. Maybe you know him, may you don't. Lalasticlala is not even in the top three.
One quirky thing I found, however, was that the time it takes for a post to get to frontpage has a heavily right-skewed distribution. Before plotting this, I lazily thought it might be normally distributed, cos...well, a lot of things are normally distributed and it shouldn't be unusual to have this normally distributed as well; few make front page early, few late, and most are in between. Right? On the contrary, the reality is skewed. I feel the heavy skewness probably points to deliberate human intervention. Most posts make front page early, not late. They are created and in little time pushed to the front page. Evidently in a deliberate fashion. Else the data should be normally distributed, don't you think? Anyways, that's what my data shows. Maybe, better insight could be derived though if one scraped randomly over the past several years in order to obtain a truly random sample.
And there were a few threads which made front page late. Very late! In the past year, we have had threads from 8 years ago make frontpage. Yes, 8 years ago! Thats's 2012. And then there are those that were initially posted 5 years ago before they made front page. Perhaps you can find more if you looked into the data set?
Anyways, getting your hands dirty with a data set is always a good way to learn data analysis. If you need help with navigating this, you can buzz me.
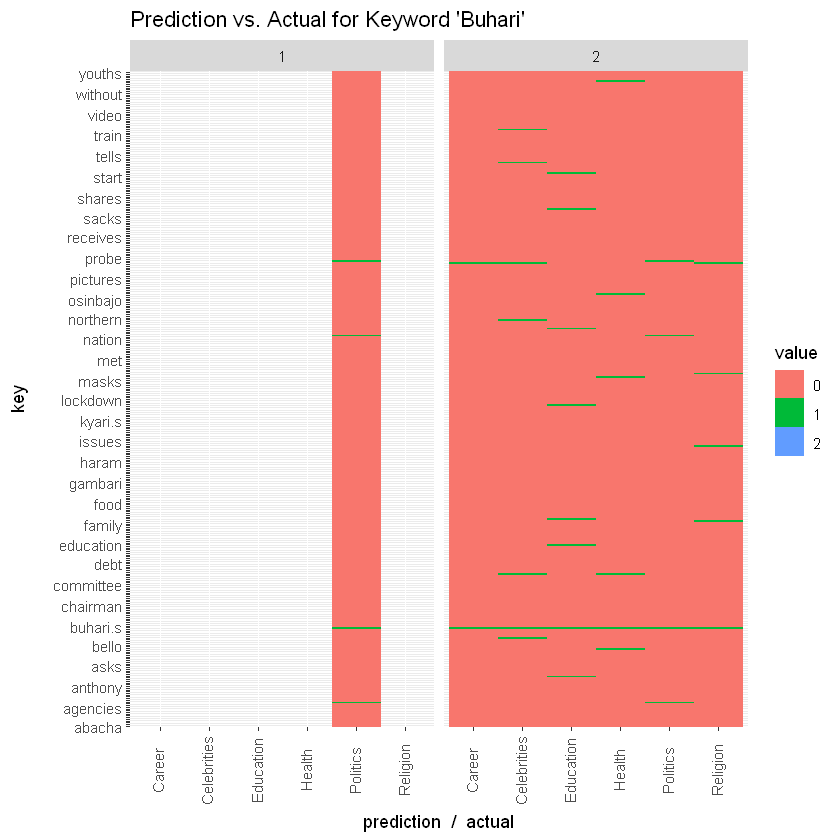
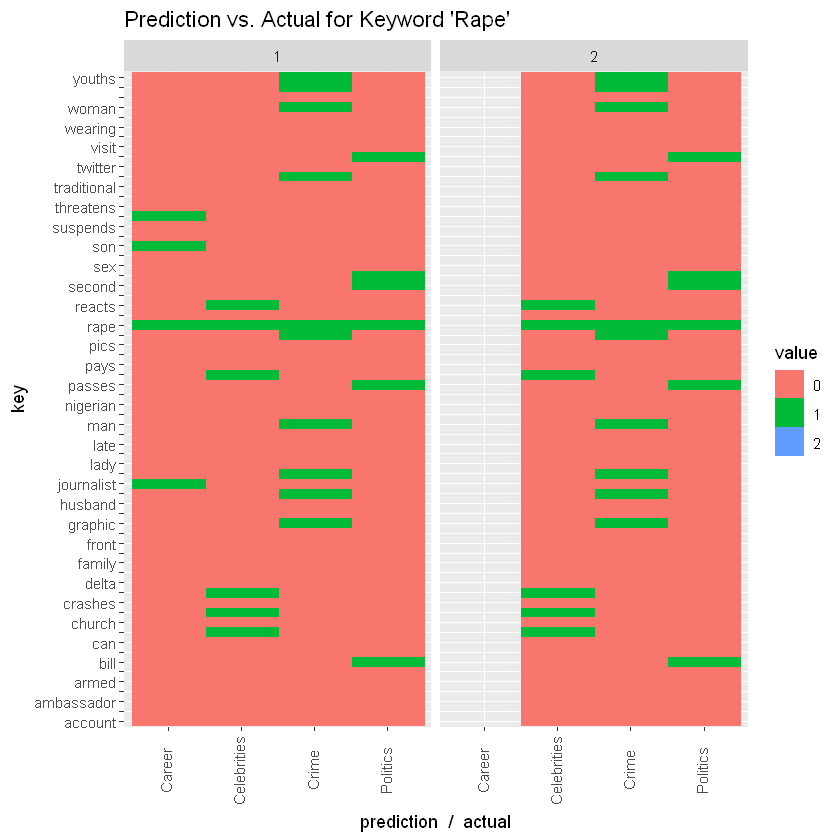
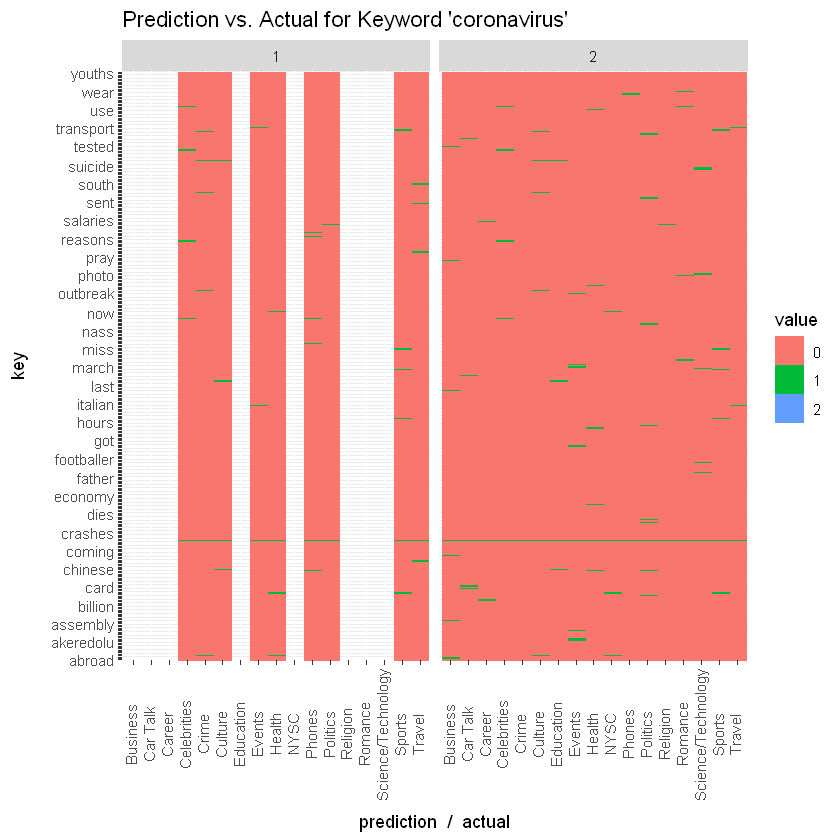
Following up on this dataset, I started wondering, can one define a machine learning question with this data set given its limited number of features? Apparently yes! In this second part, I examine procedures for fitting a model with this data set. The research question takes the form: given a post title, can one tell which section it is from? For example, given a title "COVID-19: Governor Ikpeazu's Two Aides Test Positive", can our model tell that it is from the Health section? Using NLP procedures, one can design a machine learning model which takes some part of this data set and fits a model to it, so that with the test data, we can ask questions of the remainder titles. This is a typical unsupervised model design known as classification. This particular task is multi-class classification with about 37 classes (all sections on Nairaland). This is a little harder than binary classification which has just two labels, because there are many more labels and the chances of being right for any one prediction is quite low (1/37 in this case, if we consider independence). Before fitting, I generated a wordcloud to see which words are the most prominent. Apparently, "buhari" has been a prominent word over the past year on Nairaland's front page. Little wonder it chances of occurrence was quite high in the initial analysis I did. "lagos" is also prominent. And unsurprisingly, "coronavirus" is also. SVM with a linear kernel was used for the classification task, and worked quite well. Ended up with an overall accuracy of about 69%. For some specific keywords, the accuracy was even higher. For example, for the keyword "buhari", the model placed the frontpage topic in "Politics" all the time and was correct for 96% of the time. For the keyword "rape", it had a choice of three different sections and still managed an accuracy of 84%. For the keyword "coronavirus", it didn't do so well. Managed only an accuracy of 69%. In any case, it shows that some of these predictions are possible. One can probably improve this model by training it on more features such as number of posts, post author, time of post. More features should improve its accuracy. I may get around to that if I've got more time. If you are able to do it, drop a message. 10 Likes 3 Shares 
|
| Re: Chronicle Of A Data Scientist/analyst by cochtrane(m): 1:18pm On Jun 10, 2020 |
Finally. this won't be complete without mentioning the resultant "Confusion Matrix".
Managed to create a visualization for it. When visualized, we see that for most of the sections, the correct prediction was made. There were a few sections where probably not enough values to form a cell. These appear to be "Programming", "Pets", etc. Red cells mean zero. For example, there were no successful predictions for "Webmasters". Light cells mean successful predictions. Most of the cells along the diagonal are light, correlating with the fairly good accuracy obtained.
If this catches your interest, you can download the notebook here on my github and play around with it, if you want. The code is in R. 5 Likes 1 Share 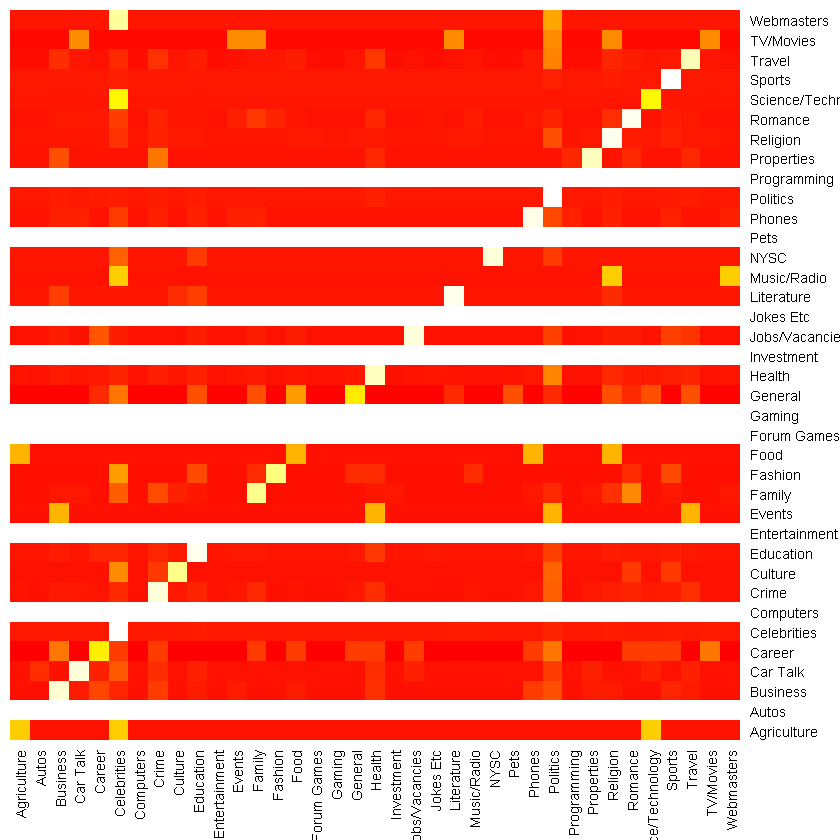
|
| Re: Chronicle Of A Data Scientist/analyst by Gcool2(m): 2:49pm On Jun 10, 2020 |
Guys,I want to drop two vital information. 1. Pls,I will advise everyone to get a Twitter account.I get motivated towards Tech everyday cos of the community of pple I surround myself with,both online and offline.You can try using Twitter and add some Tech gurus who through their posts share more insights towards programming.I will recommend @DThompsonDev .This guy will simplify every problem you feel you are encountering as a beginner. 2.If you are a beginner,I recommend "Automate the boring stuff udemy course" for you as the first step towards learning data science or data analysis.With this,other stuff you would be learning would be easier.For the beginners who started with hash analytics internship,I have spoken with a lot and I cam conclude the lack of python basics serve as setback towards understanding major concepts. Here is the link for the free udemy course. https://udemycoupons.me/automate-the-boring-stuff-with-python-programming-100-off/pls you can follow me on Twitter and let's build each other,I follow back ASAP. Follow me on Twitter @DatumCue I am a beginner like you,I want to see us Succeed . 11 Likes 4 Shares |
| Re: Chronicle Of A Data Scientist/analyst by Gcool2(m): 2:55pm On Jun 10, 2020 |
Theflint1:
Macsjebs check the visualization for top front-page posters. |
| Re: Chronicle Of A Data Scientist/analyst by Gcool2(m): 3:02pm On Jun 10, 2020 |
cochtrane:
Finally. this won't be complete without mentioning the resultant "Confusion Matrix".
Managed to create a visualization for it. When visualized, we see that for most of the sections, the correct prediction was made. There were a few sections where probably not enough values to form a cell. These appear to be "Programming", "Pets", etc. Red cells mean zero. For example, there were no successful predictions for "Webmasters". Light cells mean successful predictions. Most of the cells along the diagonal are light, correlating with the fairly good accuracy obtained.
If this catches your interest, you can download the notebook here on my github and play around with it, if you want. The code is in R.
cochtrane,you have done a wonderful job... Well-done...You made my day with this insight.keep it up.I will pm you. |
| Re: Chronicle Of A Data Scientist/analyst by cochtrane(m): 4:24pm On Jun 10, 2020 |
Gcool2:
cochtrane,you have done a wonderful job... Well-done...You made my day with this insight.keep it up.I will pm you. Thanks man |
| Re: Chronicle Of A Data Scientist/analyst by ibromodzi: 9:12pm On Jun 10, 2020 |
cochtrane:
Following up on this dataset, I started wondering, can one define a machine learning question with this data set given its limited number of features? Apparently yes!
In this second part, I examine procedures for fitting a model with this data set. The research question takes the form: given a post title, can one tell which section it is from? For example, given a title "COVID-19: Governor Ikpeazu's Two Aides Test Positive", can our model tell that it is from the Health section?
Using NLP procedures, one can design a machine learning model which takes some part of this data set and fits a model to it, so that with the test data, we can ask questions of the remainder titles. This is a typical unsupervised model design known as classification. This particular task is multi-class classification with about 37 classes (all sections on Nairaland). This is a little harder than binary classification which has just two labels, because there are many more labels and the chances of being right for any one prediction is quite low (1/37 in this case, if we consider independence).
Before fitting, I generated a wordcloud to see which words are the most prominent. Apparently, "buhari" has been a prominent word over the past year on Nairaland's front page. Little wonder it chances of occurrence was quite high in the initial analysis I did. "lagos" is also prominent. And unsurprisingly, "coronavirus" is also.
SVM with a linear kernel was used for the classification task, and worked quite well. Ended up with an overall accuracy of about 69%. For some specific keywords, the accuracy was even higher. For example, for the keyword "buhari", the model placed the frontpage topic in "Politics" all the time and was correct for 96% of the time. For the keyword "rape", it had a choice of three different sections and still managed an accuracy of 84%. For the keyword "coronavirus", it didn't do so well. Managed only an accuracy of 69%. In any case, it shows that some of these predictions are possible. One can probably improve this model by training it on more features such as number of posts, post author, time of post. More features should improve its accuracy. I may get around to that if I've got more time. If you are able to do it, drop a message. Man you are on another level.... Seun should employ you. I'll like to ask what you use for NLP; spacy, NLTK or Textblob? |
| Re: Chronicle Of A Data Scientist/analyst by Singingbae(m): 12:19am On Jun 11, 2020 |
mcemmy0z:
If you reside around songo Ota I have these available
*Udemy - Beginner to Pro in Excel Financial Modeling and Valuation
*Udemy - SQL - MySQL for Data Analytics and Business Intelligence
*Tableau 10 A-Z Hands-On Tableau Training For Data Science!
*Tableau Hands-on Learn Data Visualization with Tableau
*Udemy - Power BI A-Z Hands-On Power BI Training For Data Science
*Udemy - Machine Learning A-Z™ Hands-On Python & R In Data Science
*Udemy - Python for Financial Analysis and Algorithmic Trading Good evening sir, please I don’t know how I can meet you, I reside in Agege, but I can come to Sango one of these weekends if you can give me which is comfortable for you, I just finished python and I just got admitted to a virtual data science boot camp, I just want to be ahead of them! Thanks in anticipation |
| Re: Chronicle Of A Data Scientist/analyst by Gcool2(m): 1:51am On Jun 11, 2020 |
1 Like |
| Re: Chronicle Of A Data Scientist/analyst by cochtrane(m): 6:53am On Jun 11, 2020 |
ibromodzi:
Man you are on another level....
Seun should employ you.
I'll like to ask what you use for NLP; spacy, NLTK or Textblob? The code is written in R, and uses the tm package |
| Re: Chronicle Of A Data Scientist/analyst by ibromodzi: 8:25am On Jun 11, 2020 |
cochtrane:
The code is written in R, and uses the tm package Alright! Thanks. |
| Re: Chronicle Of A Data Scientist/analyst by elunico: 9:38am On Jun 11, 2020 |
Gcool2:
Guys,I want to drop two vital information.
1. Pls,I will advise everyone to get a Twitter account.I get motivated towards Tech everyday cos of the community of pple I surround myself with,both online and offline.You can try using Twitter and add some Tech gurus who through their posts share more insights towards programming.I will recommend @DThompsonDev .This guy will simplify every problem you feel you are encountering as a beginner.
2.If you are a beginner,I recommend "Automate the boring stuff udemy course" for you as the first step towards learning data science or data analysis.With this,other stuff you would be learning would be easier.For the beginners who started with hash analytics internship,I have spoken with a lot and I cam conclude the lack of python basics serve as setback towards understanding major concepts.
Here is the link for the free udemy course.
https://udemycoupons.me/automate-the-boring-stuff-with-python-programming-100-off/
pls you can follow me on Twitter and let's build each other,I follow back ASAP.
Follow me on Twitter @DatumCue
I am a beginner like you,I want to see us Succeed . That course isn't free. |
| Re: Chronicle Of A Data Scientist/analyst by Gcool2(m): 12:22pm On Jun 11, 2020 |
elunico:
That course isn't free. They revoked it..it was free..I downloaded couple of free courses there |
| Re: Chronicle Of A Data Scientist/analyst by elunico: 4:59pm On Jun 11, 2020 |
Gcool2:
They revoked it..it was free..I downloaded couple of free courses there OK. |
| Re: Chronicle Of A Data Scientist/analyst by DrinkWater10: 10:55pm On Jun 11, 2020 |
|
| Re: Chronicle Of A Data Scientist/analyst by DrinkWater10: 2:44am On Jun 12, 2020 |
Graspad:
Kindly explain how it works, because I'm having issues working with csv files on the laptop.
If I try to import the csv,it's saying not found. Hi. Tried downloading tutorial files from freetutorial website but I keep getting a compressed torrent file. How can I get around it? |
| Re: Chronicle Of A Data Scientist/analyst by Mikechinos(m): 6:14am On Jun 12, 2020 |
DrinkWater10:
Hi. Tried downloading tutorial files from freetutorial website but I keep getting a compressed torrent file.
How can I get around it? download it with UC browser |
| Re: Chronicle Of A Data Scientist/analyst by Generalkorex(m): 9:24am On Jun 12, 2020 |
Kaycee54321:
I think so too. He made Python Basics, a walk in the park. My email is ble2gen.360@gmail.com
Hope to hear from you soon. Link to video please |
| Re: Chronicle Of A Data Scientist/analyst by BoleAndFish: 9:41am On Jun 12, 2020 |
DrinkWater10:
Hi. Tried downloading tutorial files from freetutorial website but I keep getting a compressed torrent file.
How can I get around it? What course were you trying to download? |
