News And Technical Analysis From Instaforex - Business (11) - Nairaland
Nairaland Forum / Nairaland / General / Business / News And Technical Analysis From Instaforex (46296 Views)
Get Startup Bonus Of $500 To Trade From Instaforex / News And Technical Analysis From Superforex / News From Instaforex (2) (3) (4)
(1) (2) (3) ... (8) (9) (10) (11) (12) (13) (14) ... (23) (Reply) (Go Down)
| Re: News And Technical Analysis From Instaforex by Instaforexbuk(f): 8:57am On Jan 26, 2018 |
Technical analysis of GBP/JPY for January 26, 2018  We will retain our upside target prediction today as well. The pair is reversing up, and is now above its 20-period and 50-period moving averages. A strong support base has formed around 135.40, and should limit any downside room. In addition, the relative strength index is bullish above its neutrality area at 50, calling for a new bounce. Hence, above 154.80, look for a new rise to 155.60 and 156.10 in extension. Alternatively, if the price moves in the direction opposite to the forecast, a short position is recommended below 154.80 with the target at 154.40 Strategy: BUY, stop loss at 154.80, take profit at 155.60 Chart Explanation: the black line shows the pivot point. The price above the pivot point indicates long positions; and when it is below the pivot point, it indicates short positions. The red lines show the support levels and the green line indicates the resistance levels. These levels can be used to enter and exit trades. Resistance levels: 155.50, 156.10, and 156.50. Support levels: 154.40, 154.10, and 153.70 Read more: https://www.instaforex.com/forex_analysis/108325 |
| Re: News And Technical Analysis From Instaforex by Instaforexbuk(f): 10:19am On Jan 29, 2018 |
Technical analysis of NZD/USD for January 29, 2018 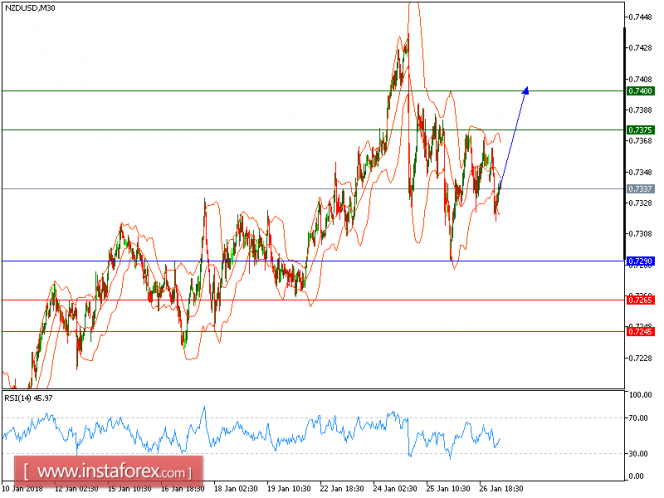 NZD/USD is expected to trade with bullish bias above 0.7290. The pair remains in an uptrend and is now trading above its 20-period and 50-period moving averages. A strong support base at 0.7290 has formed and has allowed for a temporary stabilization. Last but not least, the relative strength index is bullish above its neutrality area at 50. In which case, as long as 0.7290 is not broken, likely advance to 0.7375 and 0.7400 in extension. The black line shows the pivot point. Currently, the price is above the pivot point, which is a signal for long positions. If it remains below the pivot point, it will indicate short positions. The red lines are showing the support levels, while the green line is indicating the resistance levels. These levels can be used to enter and exit trades. Resistance levels: 0.7375, 0.7400, and 0.7450. Support levels: 0.7265, 0.7245, and 0.7240. Read more: https://www.instaforex.com/forex_analysis/108434 |
| Re: News And Technical Analysis From Instaforex by Instaforexbuk(f): 12:23pm On Jan 30, 2018 |
GBP/USD analysis for January 30, 2018  Recently, the GBP/USD pair has been trading downwards. The price tested the level of 1.3979. Anyway, according to the 30M time – frame, I found a bullish breakout of the supply trendline (resistance), which is a sign that buyers are in control. I also found a hidden bullish divergence on the moving average oscillator and a fake breakout of yesterday's low, which is another sign of strength. My advice is to watch for potential buying opportunities. The upward targets are set at the price of 1.4092 and at the price of 1.4150. Resistance levels: R1: 1.4148 R2: 1.4220 R3: 1.4280 Support levels: S1: 1.4015 S2: 1.3950 S3: 1.3880 Trading recommendations for today: watch for potential buying opportunities. Read more: https://www.instaforex.com/forex_analysis/108590 |
| Re: News And Technical Analysis From Instaforex by Instaforexbuk(f): 2:03pm On Jan 31, 2018 |
Technical analysis of GBP/JPY for January 31, 2018  Our first upside target which we predicted in yesterday's analysis has been hit. The pair turned bearish as the prices broke below the rising trend line. The downward momentum is further reinforced by both declining 20-period and 50-period moving averages. The relative strength index is calling for a drop. Therefore, below 154.45, look for a new decline with targets at 153.20 and 152.80 in extension Alternatively, if the price moves in the direction opposite to the forecast, a LONG position is recommended above 154.45 with the target at 155. Strategy: SELL, Stop loss at 154.45, Take profit at 153.20 Chart Explanation: the black line shows the pivot point. The price above the pivot point indicates long positions; and when it is below the pivot point, it indicates short positions. The red lines show the support levels, and the green line indicates the resistance levels. These levels can be used to enter and exit trades. Resistance levels: 155.00, 155.85, and 156.35 Support levels: 153.20, 152.80, and 152.40. Read more: https://www.instaforex.com/forex_analysis/108691 |
| Re: News And Technical Analysis From Instaforex by Instaforexbuk(f): 9:24am On Feb 01, 2018 |
Technical analysis of EUR/USD for Feb 01, 2018 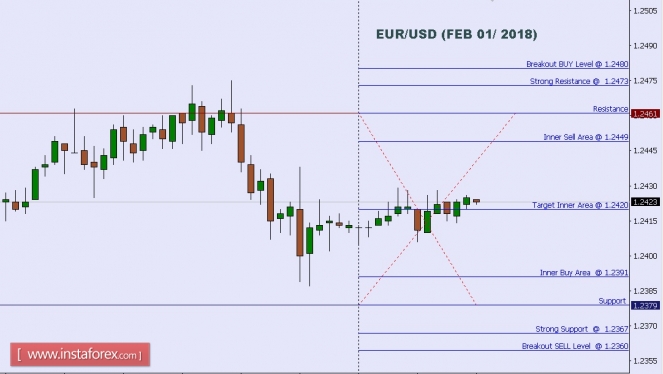 When the European market opens, some Economic Data will be released such as French 10-y Bond Auction, Spanish 10-y Bond Auction, Final Manufacturing PMI, German Final Manufacturing PMI, French Final Manufacturing PMI, Italian Manufacturing PMI, and Spanish Manufacturing PMI. The US will release the Economic Data too, such as Total Vehicle Sales, Natural Gas Storage, ISM Manufacturing Prices, Construction Spending m/m, ISM Manufacturing PMI, Final Manufacturing PMI, Unemployment Claims, Prelim Unit Labor Costs q/q, Prelim Nonfarm Productivity q/q, and Challenger Job Cuts y/y, so, amid the reports, EUR/USD will move in a medium volatility during this day. TODAY'S TECHNICAL LEVEL: Breakout BUY Level: 1.2480. Strong Resistance:1.2473. Original Resistance: 1.2461. Inner Sell Area: 1.2449. Target Inner Area: 1.2420. Inner Buy Area: 1.2391. Original Support: 1.2379. Strong Support: 1.2367. Breakout SELL Level: 1.2360. Disclaimer: Trading Forex (foreign exchange) on margin carries a high level of risk, and may not be suitable for all investors. The high degree of leverage can work against you as well as for you. Before deciding to invest in foreign exchange you should carefully consider your investment objectives, level of experience, and risk appetite. The possibility exists that you could sustain a loss of some or all of your initial investment and therefore you should not invest money that you cannot afford to lose. You should be aware of all the risks associated with foreign exchange trading, and seek advice from an independent financial advisor if you have any doubts. Read more: https://www.instaforex.com/forex_analysis/108741 |
| Re: News And Technical Analysis From Instaforex by Instaforexbuk(f): 7:53am On Feb 02, 2018 |
Technical analysis of GBP/JPY for February 2, 2018  Our first upside target which we predicted in yesterday's analysis has been hit. GBP/JPY is expected to trade with a bullish outlook. The pair is clearly in an up-trend, backed by its rising trend line. A strong support base has formed around 136.00, which should limit any downside room. Besides, the relative strength index is bullish, and calls for a new rise. To conclude, as long as 155.70 holds on the downside, look for a new bounce to 157.00 and 157.70 in extension. Alternatively, if the price moves in the direction opposite to the forecast, a Short position is recommended to be below 155.70 with the target at 155.20. Strategy: BUY, Stop loss at 155.70, Take profit at 157.00 Chart Explanation: the black line shows the pivot point. The price above the pivot point indicates long positions; and when it is below the pivot point, it indicates short positions. The red lines show the support levels, and the green line indicates the resistance levels. These levels can be used to enter and exit trades. Resistance levels: 157.00, 157.70, and 158.15 Support levels: 155.20, 154.60, and 154.00. Read more: https://www.instaforex.com/forex_analysis/108858 |
| Re: News And Technical Analysis From Instaforex by Instaforexbuk(f): 10:26am On Feb 05, 2018 |
Technical analysis of GBP/JPY for February 5, 2018  GBP/JPY is under pressure. The pair retreated from 156.60 and broke below its 20-period and 50-period moving averages. In addition, the 20-period moving average is turning down. The relative strength index is capped by a declining trend line since February 2. Therefore, below 156, look for a further decline with targets at 156.650 and 157 in extension. Alternatively, if the price moves in the direction opposite to the forecast, a Long position is recommended to be above 156.00 with the target at 156.60. Strategy: SELL, Stop loss at 156.00, Take profit at 154.60 Chart Explanation: the black line shows the pivot point. The price above the pivot point indicates long positions; and when it is below the pivot point, it indicates short positions. The red lines show the support levels, and the green line indicates the resistance levels. These levels can be used to enter and exit trades. Resistance levels: 156.60, 157.00, and 157.45 Support levels: 154.60, 154.10, and 153.70. Read more: https://www.instaforex.com/forex_analysis/108983 |
| Re: News And Technical Analysis From Instaforex by Instaforexbuk(f): 8:37am On Feb 06, 2018 |
Elliott wave analysis of EUR/JPY for February 6, 2018 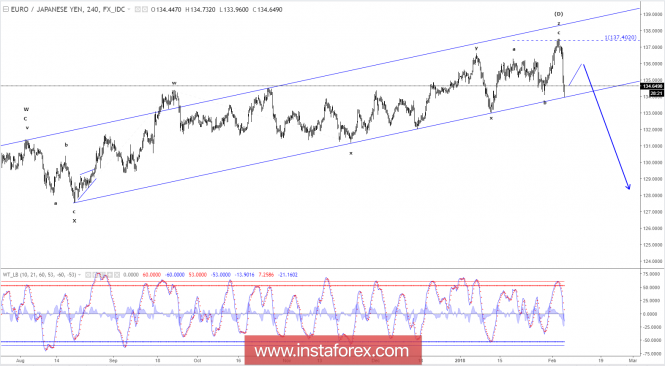 Wave summary: The strong decline from 137.50 confirms that the wave (D) finally has peaked and the wave (E) lower towards the ideal target at 123.43 now is developing. In the short-term, we will be looking for a corrective rally to 135.31 and likely even closer to 135.73 before the next strong decline towards 131.24 starts. R3: 135.73 R2: 135.31 R1: 134.80 Pivot: 134.20 S1: 133.96 S2: 133.62 S3: 133.01 Trading recommendation: We sold EUR at 137.30. We will book half profit here at 134.70 for a nice quick profit 260 pips. We will sell EUR again at 135.60 and place our stop at 137.00 for the rest of our position. Read more: https://www.instaforex.com/forex_analysis/109076 |
| Re: News And Technical Analysis From Instaforex by Instaforexbuk(f): 8:24am On Feb 07, 2018 |
Technical analysis of USD/JPY for Feb 07, 2018 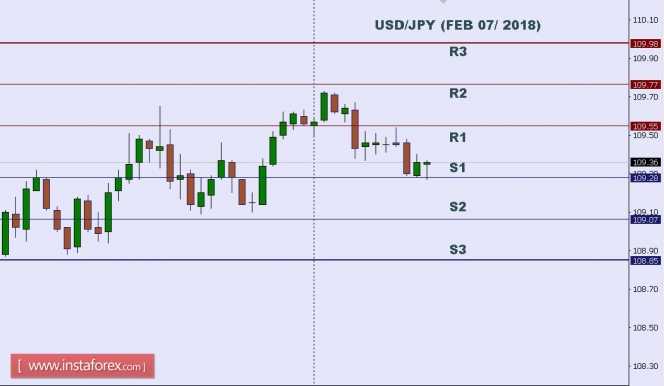 In Asia, Japan will release the Leading Indicators and Average Cash Earnings y/y data, and the US will release some Economic Data such as Consumer Credit m/m, 10-y Bond Auction, and Crude Oil Inventories. So, there is a probability the USD/JPY will move with a low to medium volatility during this day. TODAY'S TECHNICAL LEVEL: Resistance. 3: 109.98. Resistance. 2: 109.77. Resistance. 1: 109.55. Support. 1: 109.28. Support. 2: 109.07. Support. 3: 108.85. Disclaimer: Trading Forex (foreign exchange) on margin carries a high level of risk, and may not be suitable for all investors. The high degree of leverage can work against you as well as for you. Before deciding to invest in foreign exchange you should carefully consider your investment objectives, level of experience, and risk appetite. The possibility exists that you could sustain a loss of some or all of your initial investment and therefore you should not invest money that you cannot afford to lose. You should be aware of all the risks associated with foreign exchange trading, and seek advice from an independent financial advisor if you have any doubts. Read more: https://www.instaforex.com/forex_analysis/109172 |
| Re: News And Technical Analysis From Instaforex by Instaforexbuk(f): 8:11am On Feb 08, 2018 |
Fundamental Analysis of USD/CAD for February 8, 2018 USDCAD has been quite impulsive with the bullish gains recently which is expected to continue further in the coming days. USD has been the dominant currency since the recent Employment Change report was published with the significant increase which had a positive impact on the currency to gain against CAD. Ahead of the Employment Change report of CAD which is expected to decrease to 10.3k from the previous figure of 78.6k and Unemployment Rate increasing to 5.8% from the previous value of 5.7%, CAD is expected to lose more grounds against USD in the coming days. Today CAD Housing Starts report is going to be published which is expected to decrease to 211k from the previous figure of 218k, NHPI report is expected to be unchanged at 0.1% and Government Council Member Wilkins is going to speak about upcoming interest rate decision and monetary policies which are expected to inject volatility into the market before today's daily close. On the USD side, today Unemployment Claims report is going to be published which is expected to increase to 232k from the previous figure of 230k and Mortgage Delinquencies, which is the late payment value of the previous quarter for the mortgage, is expected to decrease from the previous value of 4.88%. As of the current scenario, CAD is expected to have worse economic report results in the coming days which is expected to add more to the USD gains. As USD has been in a great momentum after the recent Employment Change report, whereas worse result on the CAD Employment Change is expected to lead to more impulsive gain on USD side in the future. Now let us look at the technical view. The price has bounced higher above 1.24 recently after the positive Employment Change report of USD which was also notified in the chart as Regular Bullish Divergence. The price is currently heading towards 1.2620 from where if it is broken with a daily close, further target towards 1.29 is expected in the coming days. As the price remains above 1.24 with a daily close, the bullish bias is expected to continue further.  Read more: https://www.instaforex.com/forex_analysis/109310 |
| Re: News And Technical Analysis From Instaforex by Instaforexbuk(f): 8:43am On Feb 09, 2018 |
GBP/USD testing major resistance, remain bearish The price has shot up to test our selling area before reversing nicely once more. We remain bearish looking to sell on strength below major resistance at 1.3991 (Fibonacci retracement, horizontal pullback resistance, double top breakout level) for a strong push down to at least 1.3639 support (Fibonacci extension, double top exit potential, horizontal pullback support). RSI (34) has made a bearish exit from its long-term ascending support-turn-resistance line signaling that we should be seeing a change in momentum to bearish on GBPUSD. Sell below 1.3991. Stop loss at 1.4166. Take profit at 1.3639.  Read more: https://www.instaforex.com/forex_analysis/109387 |
| Re: News And Technical Analysis From Instaforex by Instaforexbuk(f): 12:19pm On Feb 12, 2018 |
Bitcoin analysis for 12/02/2018 French and German finance ministers are still demanding strict regulation of Bitcoin and other cryptocurrencies. According to reports, the French Finance Minister Bruno Le Maire and the Interim German Finance Minister Peter Altmaier wrote a letter to fellow finance ministers of the G20, in which they argue that cryptocurrencies are not only risky for investors but also threaten the long-term global financial stability. "Given the rapid increase in the capitalization of tokens and the emergence of new financial instruments, these changes should be closely monitored (...) Such variable tokens may have detrimental consequences for uninformed investors who do not understand the risks they are exposed to." - they write. Of course, this sentiment can be easily interpreted as coming from authorities of traditional financial institutions, experiencing increasing pressure from the rapidly growing, and the increasingly popular cryptocurrency market, which aims to disrupt traditional financial structures. The Finance Minister Bruno Le Maire and the Interim German Finance Minister Peter Altmaier are not the only ones who are concerned about Bitcoin and other cryptocurrencies. The member of the Board of the European Central Bank Yves Mersch expressed his negative opinion on Thursday, stating that cryptocurrencies are not money, nor will they be in the foreseeable future. In addition, the head of the Agency for International Settlements Agustin Carstens expressed his deep-rooted concerns by asking the central banks to close Bitcoin, claiming that cryptocurrencies are becoming a threat to financial stability. Let's now take a look at the Bitcoin technical picture at the H4 time frame. The bounce from the level of $5,830 was in three waves only, so the overall strength of the market might not be not that much visible, and the current wave progression is still in favor of another corrective wave to the upside. The key technical resistance is still the zone at the level of $9.146 - $9,515.  |
| Re: News And Technical Analysis From Instaforex by Instaforexbuk(f): 10:17am On Feb 13, 2018 |
Fundamental Analysis of GBP/USD for February 13, 2018 GBP/USD has recently broken the support area of 1.3850-1.3950 which has turned as a resistance area now. The market flow has been quite slow and corrective after breaking below the support and is expected to proceed lower in the coming days. GBP having unchanged after Official Bank Rates and Hawkish Bank of England statement failed to gain the momentum it needed to counter against the impulsive bearish move in the pair recently. Today, GBP CPI report is going to be published which is expected to decrease to 2.9% from the previous value of 3.0%, PPI Input is expected to increase to 0.7% from the previous value of 0.1%, RPI report is expected to show an unchanged value of 4.1%, Core CPI is expected to increase to 2.6% from the previous value of 2.5%, HPI report is expected to decrease to 4.9% from the previous value of 5.1%, and PPI Output is also expected to decrease to 0.2% from the previous value of 0.4%. The economic reports are expected to have mixed outcome which is expected to lead to further correction and volatility in the market ahead of the high influencing economic reports of USD to be published this week. On the other hand, today, USD NFIB Small Business Index report is going to be published which is expected to increase to 106.2 from the previous figure of 104.9, and FOMC Member Mester is going to speak about the monetary policies and the upcoming interest rate decision which is more likely to have an increase on March 2018. As of the current scenario, USD is expected to be the dominant currency in the pair having GBP struggling with the mixed economic reports and market sentiment not favoring the GBP gains despite having positive economic reports and events recently. Now let us look at the technical view. The price is currently residing at the edge of the 1.3850-1.3950 resistance area from where the price is expected to proceed lower towards the 1.36 support area. The price is being held by the dynamic level of 20 EMA as well which also increased the probability of the upcoming bearish pressure in the pair. As the price remains below the 1.3850-1.3950 resistance area, the bearish bias is expected to continue further.  Read more: https://www.instaforex.com/forex_analysis/109607 |
| Re: News And Technical Analysis From Instaforex by Instaforexbuk(f): 9:00am On Feb 14, 2018 |
Daily analysis of GBP/USD for February 14, 2018 GBP/USD continues to recover above the lows of February 9, and it's looking to test the 200 SMA at H1 chart. Around that zone, we're expecting a pullback to take place in order to test the support zone of 1.3753. That level should give up to allow more losses toward the 1.3604 level. MACD indicator remains in the neutral territory, calling for a sideways consolidation.  H1 chart's resistance levels: 1.3939 / 1.4078 H1 chart's support levels: 1.3753 / 1.3604 Trading recommendations for today: Based on the H1 chart, sell (short) orders only if the GBP/USD pair breaks a bearish candlestick; the resistance level is at 1.3753, take profit is at 1.3604, and stop loss is at 1.3903. Read more: https://www.instaforex.com/forex_analysis/109698 |
| Re: News And Technical Analysis From Instaforex by Instaforexbuk(f): 8:28am On Feb 15, 2018 |
The dollar has good reasons to turn up As a result of Wednesday, the US dollar collapsed against all major currencies. What's very strange is this happened against the background of positive data on consumer inflation in the US which showed growth in monthly terms while annual values showed a continued growth rate. According to the data presented, consumer inflation in annual terms remained at the same level of 2.1%. The forecast predicted it to fall to 1.9%. On a monthly basis, the index rose sharply by 0.5% against expectations of an increase of 0.3% and a revised upward of December's 0.2%. The figures of the basic consumer price index (CPI) were also pleasing. The annual value of the indicator remained at the previous level of 1.8%. It was assumed that it would drop to 1.7%. Last month, the base index added 0.3% while it was expected to increase by 0.2% as in December following the revision. First, the dollar reacted to these positive figures with a noticeable increase in relation to all major currencies but then everything changed. It was actively sold against major currencies which in turn, supported prices for commodity and raw materials. Against this background, the share market in the United States has grown. And the traders clearly ignored the strong growth in yields of government bonds of the US Treasury. The yield on the two-year notes added more than 2% on the day's results, indicating a strong increase in expectations for growth rates in March. Futures on federal funds jumped to around 83.1%, indicating that interest rates will be raised by 0.25% at the March meeting. In general, everything that happened in the US stock market that hit at the dollar rate, can be characterized as preparation for probable global sales. This will only intensify because of the nearest meeting of the Fed. Ultimately, the increase in yields of government bonds will have an impact on the stock market and it will begin to fall. An important signal to this is a sharp increase in the yield on Wednesday of 10-year Treasuries which grew above the 2.9% mark. In the end, we continue to expect the dollar to turn up towards the Fed meeting next month. Forecast of the day: The EURUSD pair rose on the wave of a local weakening of the dollar. It is likely that against the backdrop of rising volatility and a prospective rate hike in the US, the pair will fall to 1.2345 if it overcomes the 1.2445 mark. The GBPUSD pair also has a potential to decline to 1.3835 if it falls below the level of 1.3990. 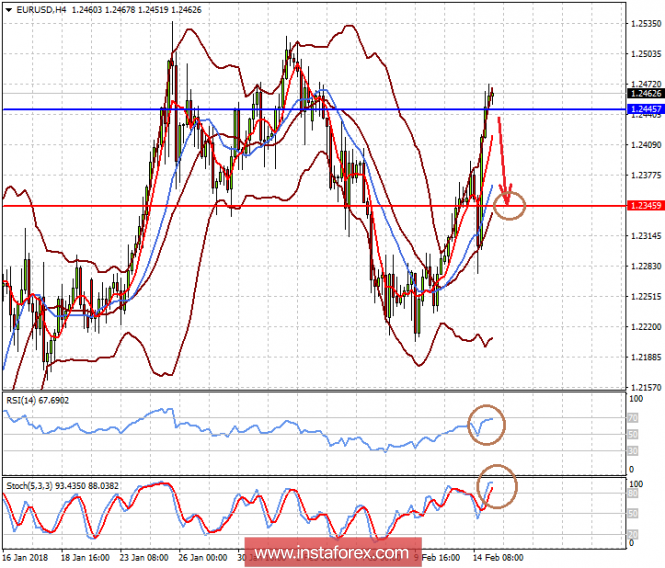 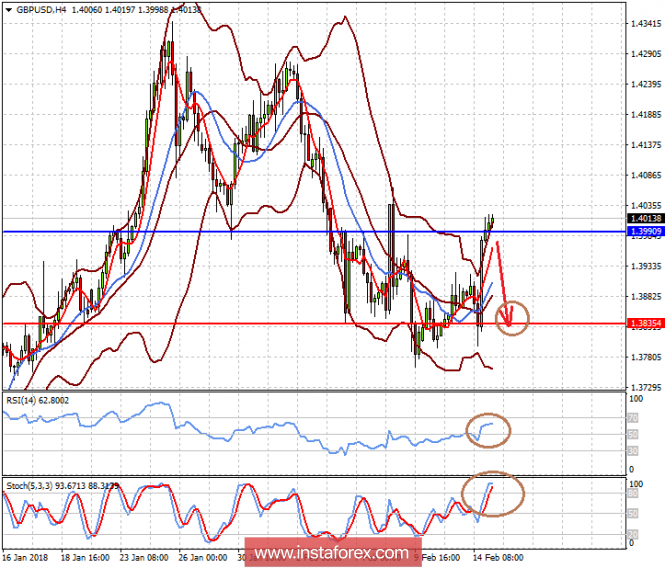 Read more: https://www.instaforex.com/forex_analysis/199790 |
| Re: News And Technical Analysis From Instaforex by Instaforexbuk(f): 11:39am On Feb 16, 2018 |
The dollar was unlucky again Data on producer prices unexpectedly turned out to be quite good, as their growth rates accelerated from 2.6% to 2.7%. However, the dollar did not help. Strongly disappointed with data on applications for benefits. Not only that the number of initial applications increased from 223, 000 to 230,000 , so the number of continuing applications increased from 1,927,000 to 1,942,000. But the growth rate of industrial production accelerated from 3.4% to 3.7%. But concerns about the overheating of the labor market prevailed, which did not allow the dollar to strengthen. Today there are data on retail sales in the UK, the growth rate of which should increase from 1.4% to 2.6%, which is a clear positive factor against the background of slowing inflation. At the same time, in the U.S., it is forecasted an increase in the number of construction project starts from 1,192,000 to 1,234, 000, while a reduction in the number of issued construction permits from 1,302, 000 to 1,300, 000. Given the strong oversold dollar, it is expected to strengthen against the backdrop of growth number of construction sites. The euro/dollar pair has all opportunities to decline to 1.2450.  It is expected to reduce the pair pound / dollar to 1.4075.  Read more: https://www.instaforex.com/forex_analysis/199887 |
| Re: News And Technical Analysis From Instaforex by Instaforexbuk(f): 7:53am On Feb 19, 2018 |
Technical analysis of GBP/USD for February 19, 2018  Overview: The GBP/USD pair opened below the resistance of 1.4055. It continued to move downwards from the level of 1.4055 to the bottom around 1.4015. Today, the first resistance level is seen at 1.4055 followed by 1.4123, while the daily support 1 is seen at 1.3901. Furthermore, the moving average (100) starts signaling a downward trend; therefore, the market is indicating a bearish opportunity below 1.4055. So it will be good to sell at 1.4055 with the first target of 1.3986. It will also call for a downtrend in order to continue towards 1.3901. The strong daily support is seen at the 1.3901 level. According to the previous events, we expect the GBP/USD pair to trade between 1.4055 and 1.3901 in the coming hours. The price area of 1.4123 remains a significant resistance zone. Thus, the trend is still bearish as long as the level of 1.4123 is not broken. On the contrary, in case a reversal takes place and the GBP/USD pair breaks through the resistance level of 1.4123, then a stop loss should be placed at 1.4160. Read more: https://www.instaforex.com/forex_analysis/110006 |
| Re: News And Technical Analysis From Instaforex by Instaforexbuk(f): 12:09pm On Feb 20, 2018 |
Analysis of gold for February 20, 2018  Recently, gold has been trading downwards. The price tested the level of $1,336.00. According to the 30M time frame, I found that the price is trading in the downward channel, which is a sign that sellers are in control. I also found a broken bearish pennant in the background, which is another sign of weakness. My advice is to watch for potential selling opportunities. The downward target is set at the price of $1,330.00. Resistance levels: R1: $1,350.07 R2: $1,353.52 R3: $1,355.65 Support levels: S1: $1,344.49 S2: $1,342.35 S3: $1,338.91 Trading recommendations for today: watch for potential selling opportunities. Read more: https://www.instaforex.com/forex_analysis/110152 |
| Re: News And Technical Analysis From Instaforex by Instaforexbuk(f): 11:18am On Feb 21, 2018 |
[B]The text of the Fed's protocol can further strengthen the dollar[/B] The market is looking forward to the publication of the text during the minutes of the meeting of the Federal Commission for Open Market Operations, as they hope to see an answer to the question regarding the pace of the rate increase. Against the backdrop of lacking news on the previous days, the dollar has some strengthened in anticipation of today's news. First preliminary data on business activity indices in Europe came out, which can further ruin the life of the single European currency. The index in the service sector should decrease from 58.0 to 57.6, and the production index from 59.6 to 59.3, and as a result, the composite index will decrease from 58.8 to 58.5. But the pound has a chance to improve its position to some extent. Not only that, the number of applications for unemployment benefit in the previous month of 8,600 last month may increase by 4,100 amid the stability of the unemployment rate and the rate of wage growth. Also, borrowing of the public sector should be reduced by 11.1 billion pounds. However, the dollar's growth will increase in the second half of the day. Preliminary data on indices of business activity can show growth. In particular, the index in the service sector should grow from 53.3 to 54.0, although the production index may fall from 55.5 to 55.4. But the service sector has a heavier impact, the composite index is expected to grow from 53.8 to 54.4. Moreover, home sales in the secondary market may show an increase of 0.9%. Well, the most important event not only for the day but also for the whole week s the publication of the text of the minutes of the recent meeting of the Federal Commission for Open Market Operations. The regulator planned, as many as, three increases for the current year. If the Fed confirms its plans last year, then the dollar will have many reasons for growth. The EUR/USD pair will decline to the level of 1.2250. If the contents of the text of the protocol disappoint investors, we should expect growth to 1.2425.It should contain answers to the question about the rate of increase in the refinancing rate in the current year. At the moment, almost everyone agrees that the Fed will raise the rate at least once. But do not forget, this was similar even last year.  If the text of the minutes of the meeting of the Federal Commission for Operations in the open market will please investors, the GBP/USD pair will drop to the level of 1.3850. Otherwise, we expect growth to 1.4100.  Read more: https://www.instaforex.com/forex_analysis/200197 |
| Re: News And Technical Analysis From Instaforex by Instaforexbuk(f): 7:49am On Feb 22, 2018 |
AUD/USD is approaching major support, prepare for a bounce Price is approaching major support at 0.7731 (Fibonacci extension, Fibonacci retracement, horizontal overlap support), and a strong bounce from this level would push the price up towards the 0.7986 resistance (Fibonacci retracement, horizontal swing high resistance). We have to be careful about intermediate resistance at 0.7890 too. Stochastic (34,5,3) is seeing major support at 0.4% where a corresponding bounce could occur. Buy above 0.7731. Stop loss at 0.7633. Take profit at 0.7986. 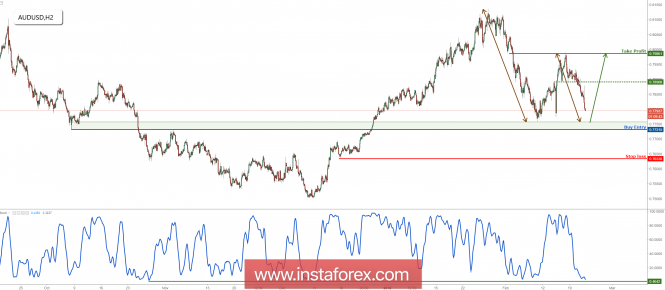 Read more: https://www.instaforex.com/forex_analysis/110294 |
| Re: News And Technical Analysis From Instaforex by horlajumokhe(f): 4:56pm On Feb 22, 2018 |
Hello, I am interested in trading forex. Pls tell me how to start trading please, also how much is needed to start . |
| Re: News And Technical Analysis From Instaforex by Instaforexbuk(f): 8:19am On Feb 23, 2018 |
[quote author=horlajumokhe post=65287514]Hello, I am interested in trading forex. Pls tell me how to start trading please, also how much is needed to start .[/quote First of all, we recommend you to familiarize yourself with the section “For Beginners” at our website - http://instaforex.com/for_beginners . Also a great many of helpful information was placed at our special educational website http://education.instaforex.com. After getting acquainted with the trading basics, the best decision will be to open a Demo-account (just download the trading terminal by this link: https://www.instaforex.com/trading_platform.php and after the program startup fill in the proper field in the emerged window). Having obtained necessary skills of trading on Demo-accounts you can start registration of a real trading account at our website: http://instaforex.com/open_live_account.php . You can start trading with minimum of $1. |
| Re: News And Technical Analysis From Instaforex by Instaforexbuk(f): 10:08am On Feb 23, 2018 |
The trade review for February 23 by simplified wave analysis Overview and Outlook for #USDX (US Dollar Index) As shown in the graph of the American currency index, the formation of an extended downward plane continued during the last three years. Since the beginning of last year, the final part of the wave model started. The structure of the entire wave does not show completeness. The strong level of support reached by the quotes triggered the formation of a corrective zone, in the form of a flat. The expected growth potential is limited by the determined resistance zone. Today, the completion of the bearish retracement that began yesterday is expected. The lower zone is the support level. A short-term gap of the lower boundary is not excluded. A reversal through the upward movement can be expected in the afternoon. Boundaries of resistance zones: - 90.50 / 60 Boundaries of support zones: - 89.70 / 60  Review and Forecast for NZD / USD The last wave of the daily chart of the major currency "Kiwi" dollar in September 2016 brought the pair's price into the zone of a strong resistance line. Over the next year and a half, the price formed a correction in a wide flat corridor. As of now, the correctional structure has been completely completed and its entire parts have been formed. For today, the last and incomplete ascending part have a reversal potential. The first part of the wave (A) is complete. Since January 24, a flat correction zigzag (B) began to form. Due to the impulsive nature of the bullish wave that has started, we can expect a minimum possible reduction. During the next trading sessions, the following events are expected such as the completion of the downward rollback, the reversal formation and the beginning of the ascending phase of the pair's movement. Boundaries of resistance zones: - 0.7250 / 80 Boundaries of support zones: - 0.7270 / 40  Explanations to the figures: For simplified wave analysis, the simplest type of wave is used in the form of a zigzag, combining 3 parts (A; B; C). Of these waves, all kinds of correction are composed and most of the impulses. At each time frame, the last, incomplete wave is analyzed. The areas marked on the graphs are indicated by the calculation areas, where the probability of a change in the direction of motion is significantly increased. Arrows indicate the wave counting according to the technique used by the author. The solid background of the arrows indicates the structure formed, the dotted one indicates the expected wave motion. Attention: The wave algorithm does not take into account the duration of the tool movements in time. The forecast is not a trading signal! To conduct a trade transaction, you need to confirm the signals of your trading systems. * The presented market analysis is informative and does not constitute a guide to the transaction. Read more: https://www.instaforex.com/forex_analysis/200339 |
| Re: News And Technical Analysis From Instaforex by Instaforexbuk(f): 2:47pm On Feb 26, 2018 |
Technical analysis of EUR/USD for February 26, 2018  Overview: The trend of the EUR/USD pair movement was controversial as it took place in a narrow sideways channel, the market showed signs of instability. Amid the previous events, the price is still moving between the levels of 1.2259 and 1.2373. Also, the daily resistance and support are seen at the levels of 1.2408 and 1.2442, respectively. Therefore, it is recommended to be cautious while placing orders in this area. So, we need to wait until the sideways channel has completed. Last week, the market moved from its bottom at 1.2260 and continued to rise towards the top of 1.2352. Today, in the one-hour chart, the current rise will remain within a framework of correction. However, if the pair fails to pass through the level of 1.2404, the market will indicate a bearish opportunity below the strong resistance level of 1.2404. Since there is nothing new in this market, it is not bullish yet. Sell deals are recommended below the level of 1.2404 with the first target at 1.2295. If the trend breaks the support level of 1.2295, the pair is likely to move downwards continuing the development of a bearish trend to the level 1.2260 in order to test the double bottom again. Read more: https://www.instaforex.com/forex_analysis/110582 |
| Re: News And Technical Analysis From Instaforex by Instaforexbuk(f): 9:04am On Feb 27, 2018 |
USD/CHF is testing strong resistance, it's time to start selling Price is testing major resistance at 0.9390 (Fibonacci extension, bearish harmonic formation, descending resistance) and a strong reaction could occur at this level to push the price down to the 0.9321 support (Fibonacci retracement, horizontal overlap support). Stochastic (34,5,3) is seeing major resistance at 93% where a corresponding reaction could occur. Sell below 0.9390. Stop loss at 0.9415. Take profit at 0.9321. 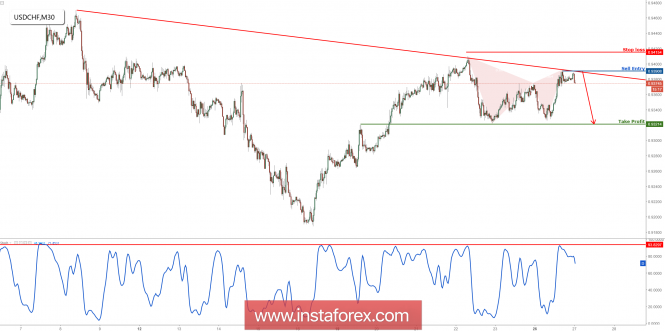 Read more: https://www.instaforex.com/forex_analysis/110620 |
| Re: News And Technical Analysis From Instaforex by Instaforexbuk(f): 8:39am On Feb 28, 2018 |
Technical analysis of GBP/JPY for February 28, 2018  GBP/JPY is under pressure. The pair is clearly turning down, and is also under pressure below its horizontal level at 149.60. A bearish cross has been identified between the 20-period and 50-period moving averages, which should confirm a negative outlook. In which case, as long as the resistance at 149.60 is not surpassed, the risk of the break below 148.50 remains high. Alternatively, if the price moves in the direction opposite to the forecast, a long position is recommended to be above 149.60 with the target at 150.00. Strategy: SELL, Stop loss at 149.60, Take profit at 148.50 Chart Explanation: The black line shows the pivot point. The price above the pivot point indicates long positions; and when it is below the pivot point, it indicates short positions. The red lines show the support levels, and the green line indicates the resistance levels. These levels can be used to enter and exit trades. Resistance levels: 150.00, 150.50, and 151.00 Support levels: 148.50, 147.95, and 147.50 Read more: https://www.instaforex.com/forex_analysis/110766 |
| Re: News And Technical Analysis From Instaforex by Instaforexbuk(f): 8:39am On Mar 05, 2018 |
Daily analysis of EUR/JPY for March 5, 2018 EUR/JPY This cross pair is a weak market. It is interesting to see the market is engaged in a long, protracted bearish movement. Since the beginning of February, at least, 700 pups have been shed. In the past few weeks, short-term rallies have been invariably followed by further southwards movements. 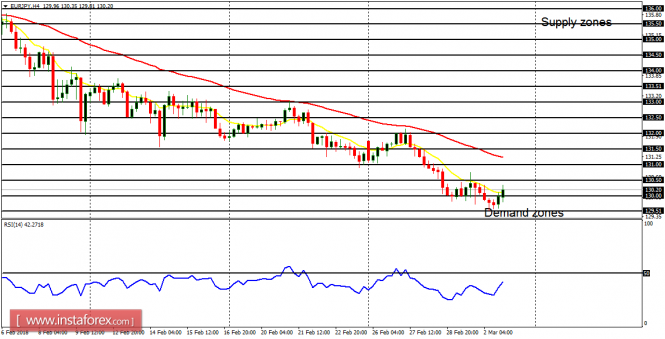 There is currently a Bearish Confirmation Pattern in the market. The price would continue moving downwards towards the demand zones at 130.00, 129.50 and 129.00. Nonetheless, a strong rally is in the offing, as the outlook on EUR pairs is bullish for this week. Read more: https://www.instaforex.com/forex_analysis/111090 |
| Re: News And Technical Analysis From Instaforex by Instaforexbuk(f): 8:46am On Mar 06, 2018 |
Fundamental Analysis of USD/JPY for March 6, 2018 USD/JPY has been quite impulsive with the bullish gains recently after bouncing off the important support area of 105.50. JPY has been quite positive with the recent economic reports like significant decrease in Unemployment Rate from 2.8% to 2.4%, which made the currency to gain significant momentum along the way against USD. Ahead of the upcoming high impact economic reports on the USD side this week and probable Interest Rate Hike this month, USD is currently recovering quite well from the impulsive JPY strike. Today, USD Factory Orders report is going to be published which is expected to decrease to -0.4% from the previous positive value of 1.7%, and IBD/TIPP Economic Optimism report is expected to increase to 58.2 from the previous figure of 56.7. Ahead of the upcoming Non-Farm Employment Change, Average Hourly Earnings, and Unemployment Rate report, USD is expected to gain certain momentum which may lead to further bullish pressure in the pair. Today, we do not have any JPY economic report to impact the market but on Thursday, JPY Bank Lending report is going to be published which is expected to be unchanged at 2.4%, Current Account is expected to increase to 1.76T from the previous figure of 1.48T, Final GDP Price Index is expected to be unchanged at 0.0%, and Final GDP is expected to increase to 0.2% from the previous value of 0.1%. As of the current scenario, this week the market is expected to be quite volatile whereas a number of high impact economic reports on the both sides are expected to inject uncertainty for the time being. To sum up, ahead of the upcoming economic reports, USD is expected to gain and sustain the bullish momentum in the pair if the economic reports are published better than expected by Friday daily close. Now let us look at the technical view. The price has been quite impulsive with the gains yesterday having bouncing off the 105.50 price area. The bearish trend has been quite non-volatile whereas certain retracement towards the 20 EMA and 107.30-50 area is expected before the price continues its bearish pressure in the coming days. As the price remains below the 108.50 price area, the bearish bias is expected to continue further.  Read more: https://www.instaforex.com/forex_analysis/111225 |
| Re: News And Technical Analysis From Instaforex by Instaforexbuk(f): 9:06am On Mar 07, 2018 |
Fundamental Analysis of USD/CAD for March 7, 2018 USDCAD has been extremely volatile and indecisive recently after breaking above 1.29 price area with a daily close. The price is still struggling to make a definite trend move in this pair which is currently expected to proceed higher in the coming days. The economic calendar contains a series of high impact economic reports from the US such as Non-Farm Employment Change, Unemployment Rate, and Average Hourly Earnings which are expected to show optimistic readings. Today ADP Non-Farm Employment Change report is going to be published which is expected to decrease to 199k from the previous figure of 234k, FOMC Members Bostic and Dudley are going to speak today about the nearest interest rate hike this month along with future monetary policies, investors expect to detect the hawkish stance in their comments. Market participants are currently quite biased with the US reports ahead of the upcoming Rate Hike this month. On the CAD side, there are high impact economic reports too. Today, Canada's Overnight Rate decision is going to be published which is expected to be unchanged at 1.25% along with BOC Rate Statement expected to be quite neutral today. Moreover, this week on Friday, Canada's Employment Change report is going to be published which is expected to show a significant increase to 21.8k from the previous negative figure of -88.0k and Unemployment Rate is expected to be unchanged at 5.9%. To sum up, this week the USD/CAD pair is likely to be highly volatile and indecisive until the weekly close on Friday but USD is expected to have an upper hand over CAD in the hsort term in light of the upcoming economic reports and events on the USD side this month. Now let us look at the technical view. The price is currently residing above 1.29 price area, affected by impulsive bearish pressure yesterday that leding to a daily close below it. The market is currently quite indecisive ahead of the upcoming high impact economic reports and events from the US and Canada. As for the current scenario, the price is expected to trade with a bullish biased as it remains above 1.29 with a daily close which is more probable until price breaks below the 1.29 price area with a daily close.  Read more: https://www.instaforex.com/forex_analysis/111344 |
| Re: News And Technical Analysis From Instaforex by Instaforexbuk(f): 7:07am On Mar 08, 2018 |
Gold was trapped The news about the resignation of the chief economic adviser to the president Gary Cohn allowed gold to mark its best daily level since Valentine's Day. If an ardent opponent of protectionism, an ex-candidate for the presidency of the Fed, withdraws from his post, a potential global trade war is unlikely to be avoided. And in it, all weapons will look good. Including - large-scale selling of US Treasury bonds by the main holders in the face of China and Japan. I believe other countries will do the same. Their desire to get rid of the power of the dollar will force them to shift to gold. Thus, trade wars are potentially capable of providing the precious metal with invaluable support. Until March, investors' demand for ETF products was characterized by mixed dynamics. The fall in the XAU/USD and the increase in gold volatility contributed to an outflow of 5.1 tonnes in February. The biggest losses were suffered by European (-7.3 tons) and North American stock-exchange specialized funds (-5.1 tons), while Asians, on the contrary, replenished their reserves (+7.9 tons). As a result, according to the latest figure, it has increased by 10% since the beginning of the year. Monthly dynamics of demand for ETF products 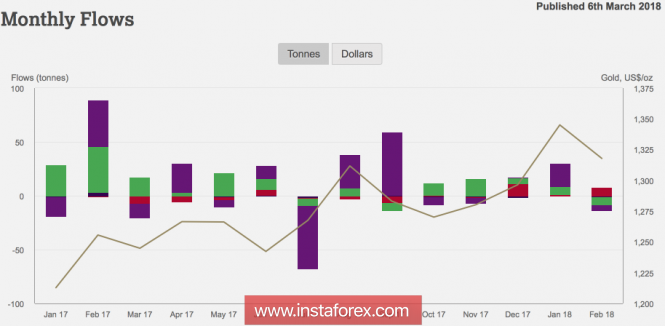 Source: WGC. Annual dynamics of demand for ETF products 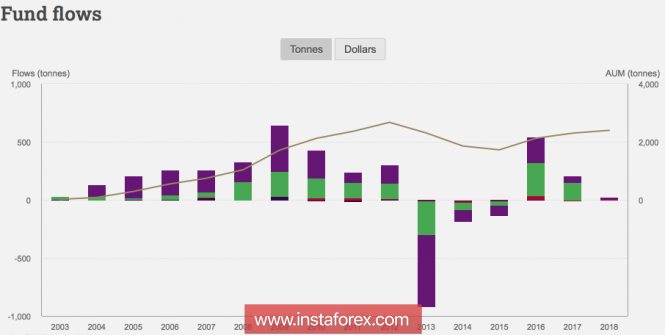 Source: WGC. In my opinion, the value of the investment demand for precious metals was influenced by the strengthening of the US dollar. The fastest growth in the weekly wage in January over the past few years has strengthened the risks of overclocking inflation and the aggressive monetary tightening of the Fed. Moreover, the new head of the Federal Reserve was optimistic about the US economy and the way of betting on federal funds. The President of the Federal Reserve Bank of New York, William Dudley, indicated four hikes in 2018 - a gradual normalization of monetary policy. As a result, the futures market increased the chances of such an outcome to 34%, and gold plunged into a wave of selling. Everyone remembers perfectly how uncomfortable it felt at the eve of the historic FOMC meetings in 2017. Nevertheless, the growing likelihood of the implementation of the policy of anti-globalization, Donald Trump, significantly tempered investors' appetite for risk. If the stock indexes behaved rather restrained in response to the high-sounding statements of the US president on tariffs on the import of steel and aluminum, the resignation of Gary Cohn convinced that the matter should be taken very seriously. In the medium term, gold can be trapped in consolidation: on the one hand, news about the trade war will provide support to the bulls on the XAU/USD; on the other hand, the return of the divergence idea in the monetary policy of the Federal Reserve and the central banks-peers can become a saving straw for the US dollar. In my opinion, in the second and third quarters, against the background of the return of the normalization theme, its strength will run out, so the price will drop to the lower border of the trading range of $1300-1360 per ounce, which makes sense to use for purchases. Technically, if the bulls manage to return gold quotes to the limits of the upward medium-term trading channel, then the risks of implementing the target values by 113% and by 127.2% according to the Shark and AB = CD patterns will increase. Gold, daily chart 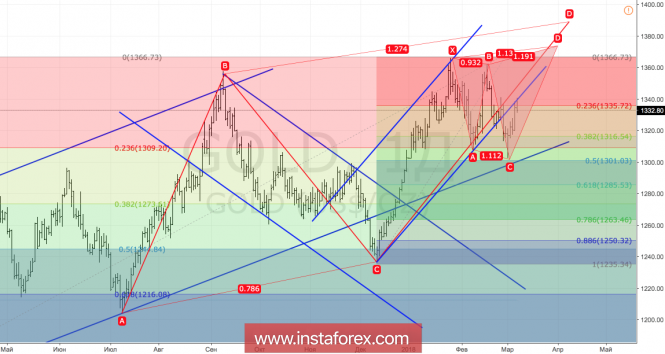 Read more: https://www.instaforex.com/forex_analysis/201237 |
| Re: News And Technical Analysis From Instaforex by Instaforexbuk(f): 7:54am On Mar 09, 2018 |
Daily analysis of USD/JPY for March 9, 2018 USD/JPY There is a growing challenge to the recent bearish bias on the market. Since the demand level at 105.50 was tested, the market has gained 130 pips. Price is now above the demand level at 106.50, going towards the supply level at 107.00. There is a possibility of a change in the market bias when price goes further northwards.  The long-term bias is bearish. The EMA 11 is below the EMA 56, and the RSI period 14 is slightly below the level 50. There is currently a Bearish Confirmation Pattern on the 4-hour chart, but that will be overturned once the supply level at 107.50 is breached to the upside. Read more: https://www.instaforex.com/forex_analysis/111542 |
(1) (2) (3) ... (8) (9) (10) (11) (12) (13) (14) ... (23) (Reply)
Conspiracy Theory Of What Could ‘happen’ To Naira/dollar In The Next Few Weeks / Naira Exchange Rates Today / Credit Alert From An Unknown Person
(Go Up)
| Sections: politics (1) business autos (1) jobs (1) career education (1) romance computers phones travel sports fashion health religion celebs tv-movies music-radio literature webmasters programming techmarket Links: (1) (2) (3) (4) (5) (6) (7) (8) (9) (10) Nairaland - Copyright © 2005 - 2024 Oluwaseun Osewa. All rights reserved. See How To Advertise. 152 |